
Blog Layout
PQM sample report
rleonard85 • Jan 23, 2022

POWER QUALITY STUDY
PERFORMED AT THE DIRECTION OF
ANYBODY
ANYWHERE
USA
FOR
BIG POWER USER ANYWHERE
25 EAST POWER STREET
ANYWHERE, USA
PANOPTIC SOLUTIONS REFERENCE: #72312 SUBMITTED BY: MIKE P. CARR
ATTENTION: ANYBODY
WORK PERFORMED: JULY 23 - 30, 2012
REPORT COMPLETED: AUGUST 6, 2012
PURPOSE
To capture data and review as directed for evidence to explain the frequent interruptions due to phase monitoring shut down of main 240 volt delta service at the 25 East Howard Street plant.
METHOD
Your representative will remove the panel cover. Panoptic Solutions personal will install the PQM, after putting on PPE, working with your man to feed test leads through the panel cover and assisting him with reinstallation of cover. The PQM will then be set up and run for 10 minutes and checked to ensure data is being collected. The meter will be reset and monitoring will begin for a period of 7 days. The above process will be repeated in reverse to remove the test leads from the panel. The collected data will be processed, reviewed and analysis will be submitted.
SUMMARY
The PQM was set up to capture voltage, amperage, frequency and harmonic distortion. The swell and sag exception capture was set at 10% of nominal voltage. When we reviewed the data we found 10 exceptions: 1 interruption of ½ second on the AC reading, 7 sags greater than 10% of nominal voltage ranging from 214 volts to 108 volts, 6 of these were on the AB reading and 2 swells greater than 10% of nominal voltage associated with the return of power after the interruption.
RESULTS AND RECOMMENDTIONS
Careful review of all data collected in the 7 day study indicates that several dips occurred on the line 1-2 feed with a power loss on the 3-1 feed. I checked the weather in Des Plaines at the time of the events and found no storm activity that would account for the power quality issues we found.
No concerns were found with unbalanced feed voltage, harmonics, or frequency. I recommend a review of equipment in use before and after the power interruption on the 25th of July to be certain that no amperage harmonic concerns are indicated that day between the power loss and 6:00 am.
I believe that the information we collected may indicate the phase monitoring equipment opening the main breaker several times recently was warranted and is not an indication of its failure.
Detailed Report
In the following pages we have provided information on our findings and visuals to show what we describe.
Voltage and Amperage review:
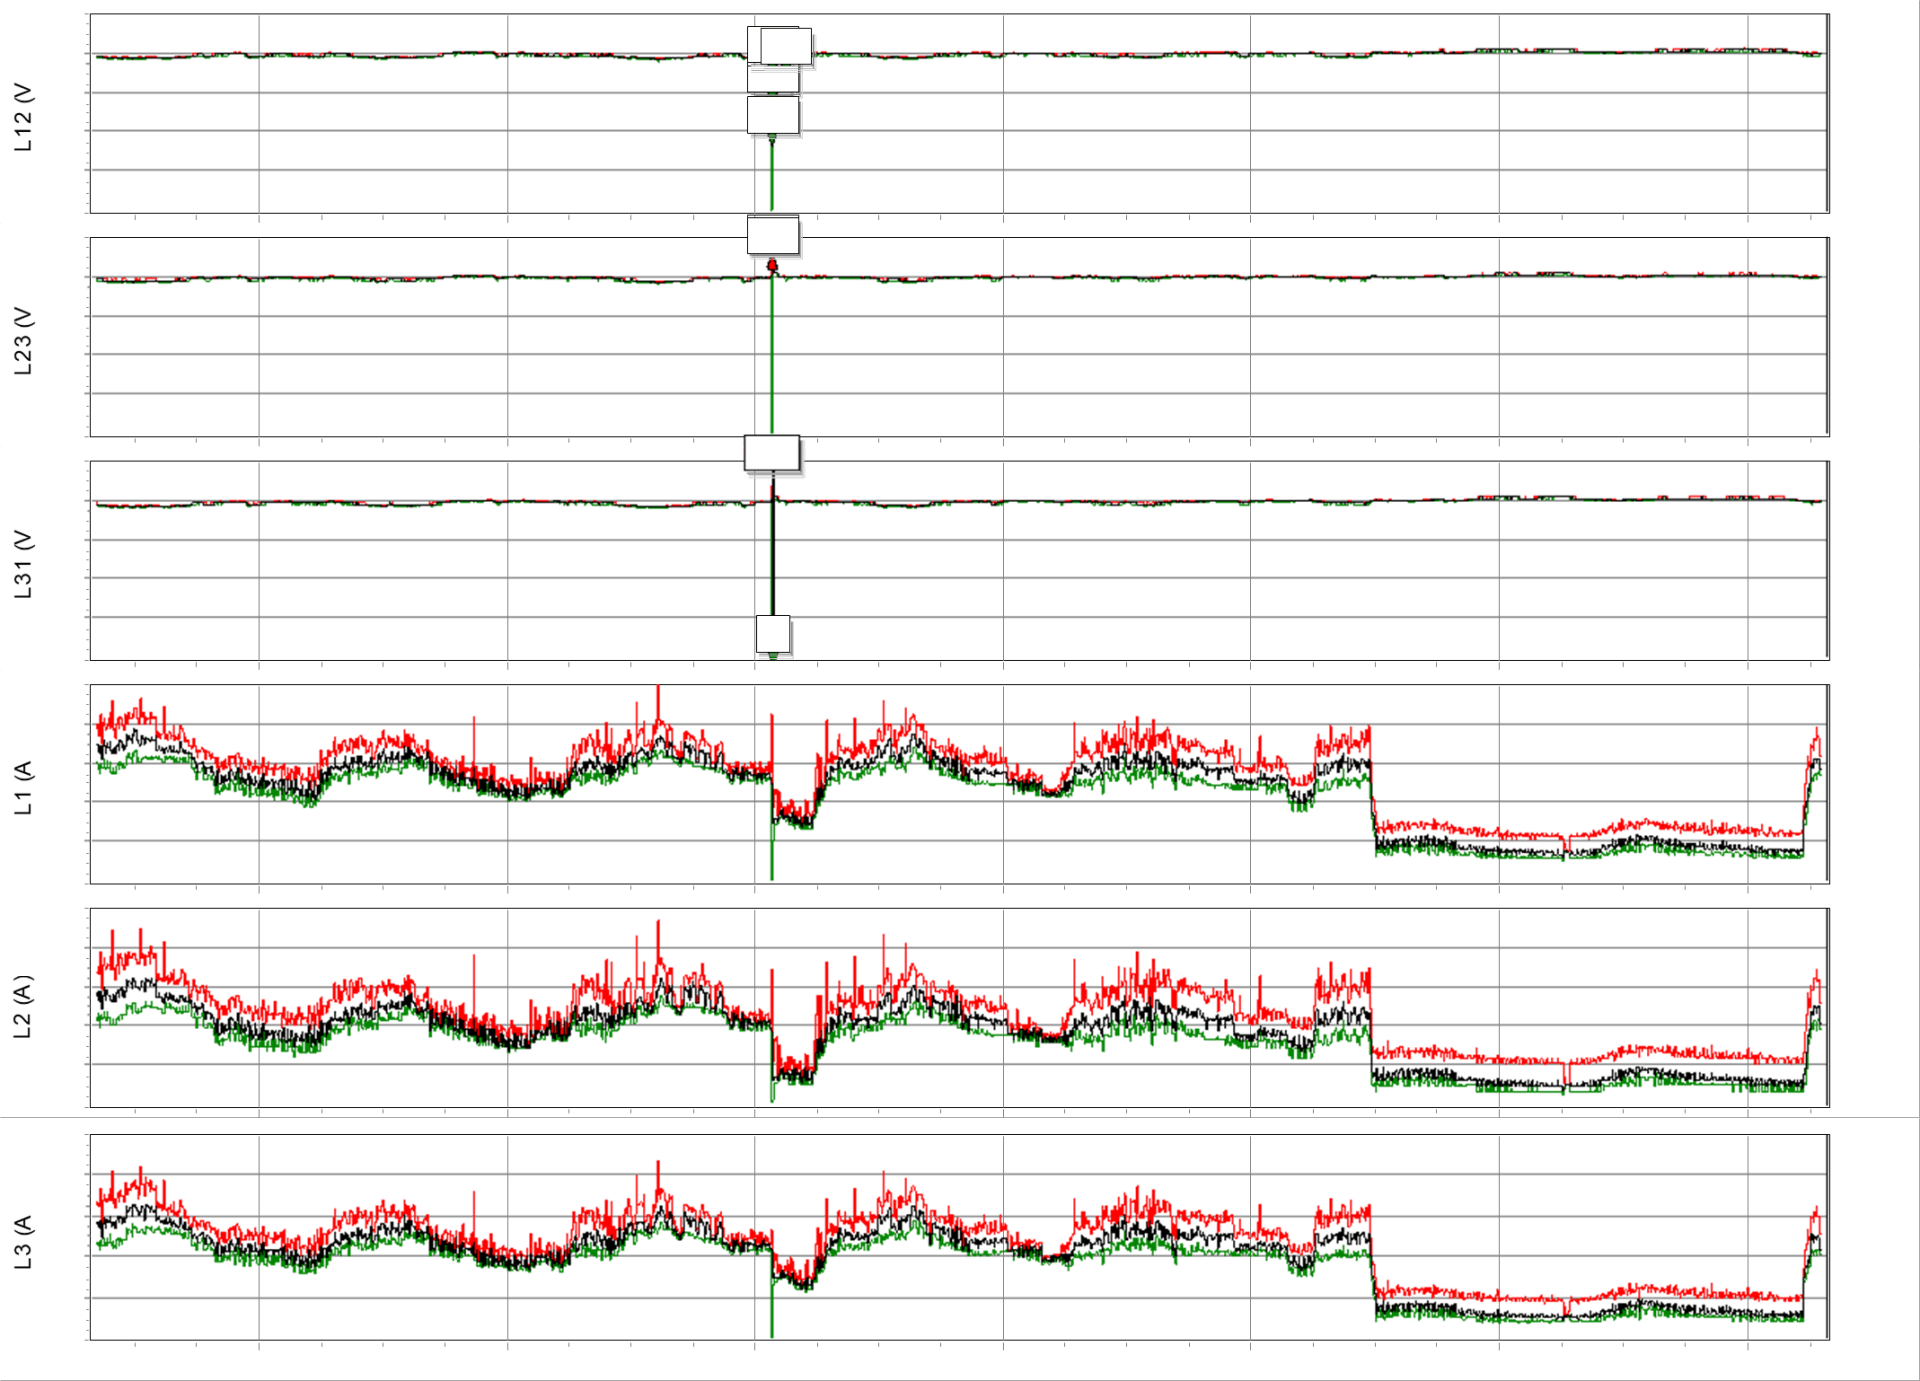
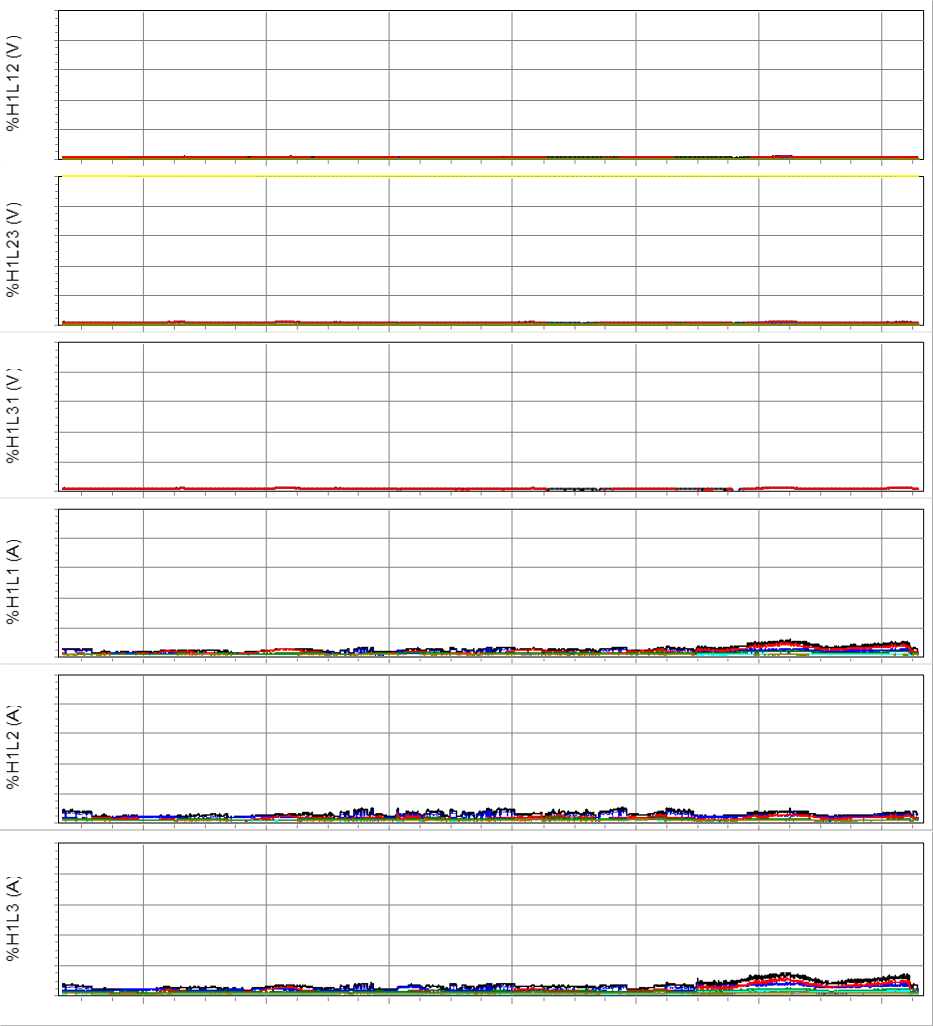
As seen on the graph below the voltage was constant throughout the study period. There is not a pattern of unbalance between the phases that is significant.
The same graph shows the amperage is also fairly constant with spikes when large motors start and a pattern of variance that follows the daily schedule. The unbalance seen between phases is consistent with that expected in a “B” phase grounded system like this one.
Voltage and Amperage review:
As seen on the graph below the voltage was constant throughout the study period. There is not a pattern of unbalance between the phases that is significant.
The same graph shows the amperage is also fairly constant with spikes when large motors start and a pattern of variance that follows the daily schedule. The unbalance seen between phases is consistent with that expected in a “B” phase grounded system like this one.
Weeklong Trend
Voltage - Amperage
There were 10 events on July 25th between 1:30 and 3:00 am. All involved voltage swells, dips or complete loss of power. Nine of these events took place within 1 minute between 1:42 and 1: 43.
The events are captured on the graph below. Note phase “A” has 5 dips, Phase “B” has 2 swells and the power loss is on phase “C”. All incoming power was affected in this time period.
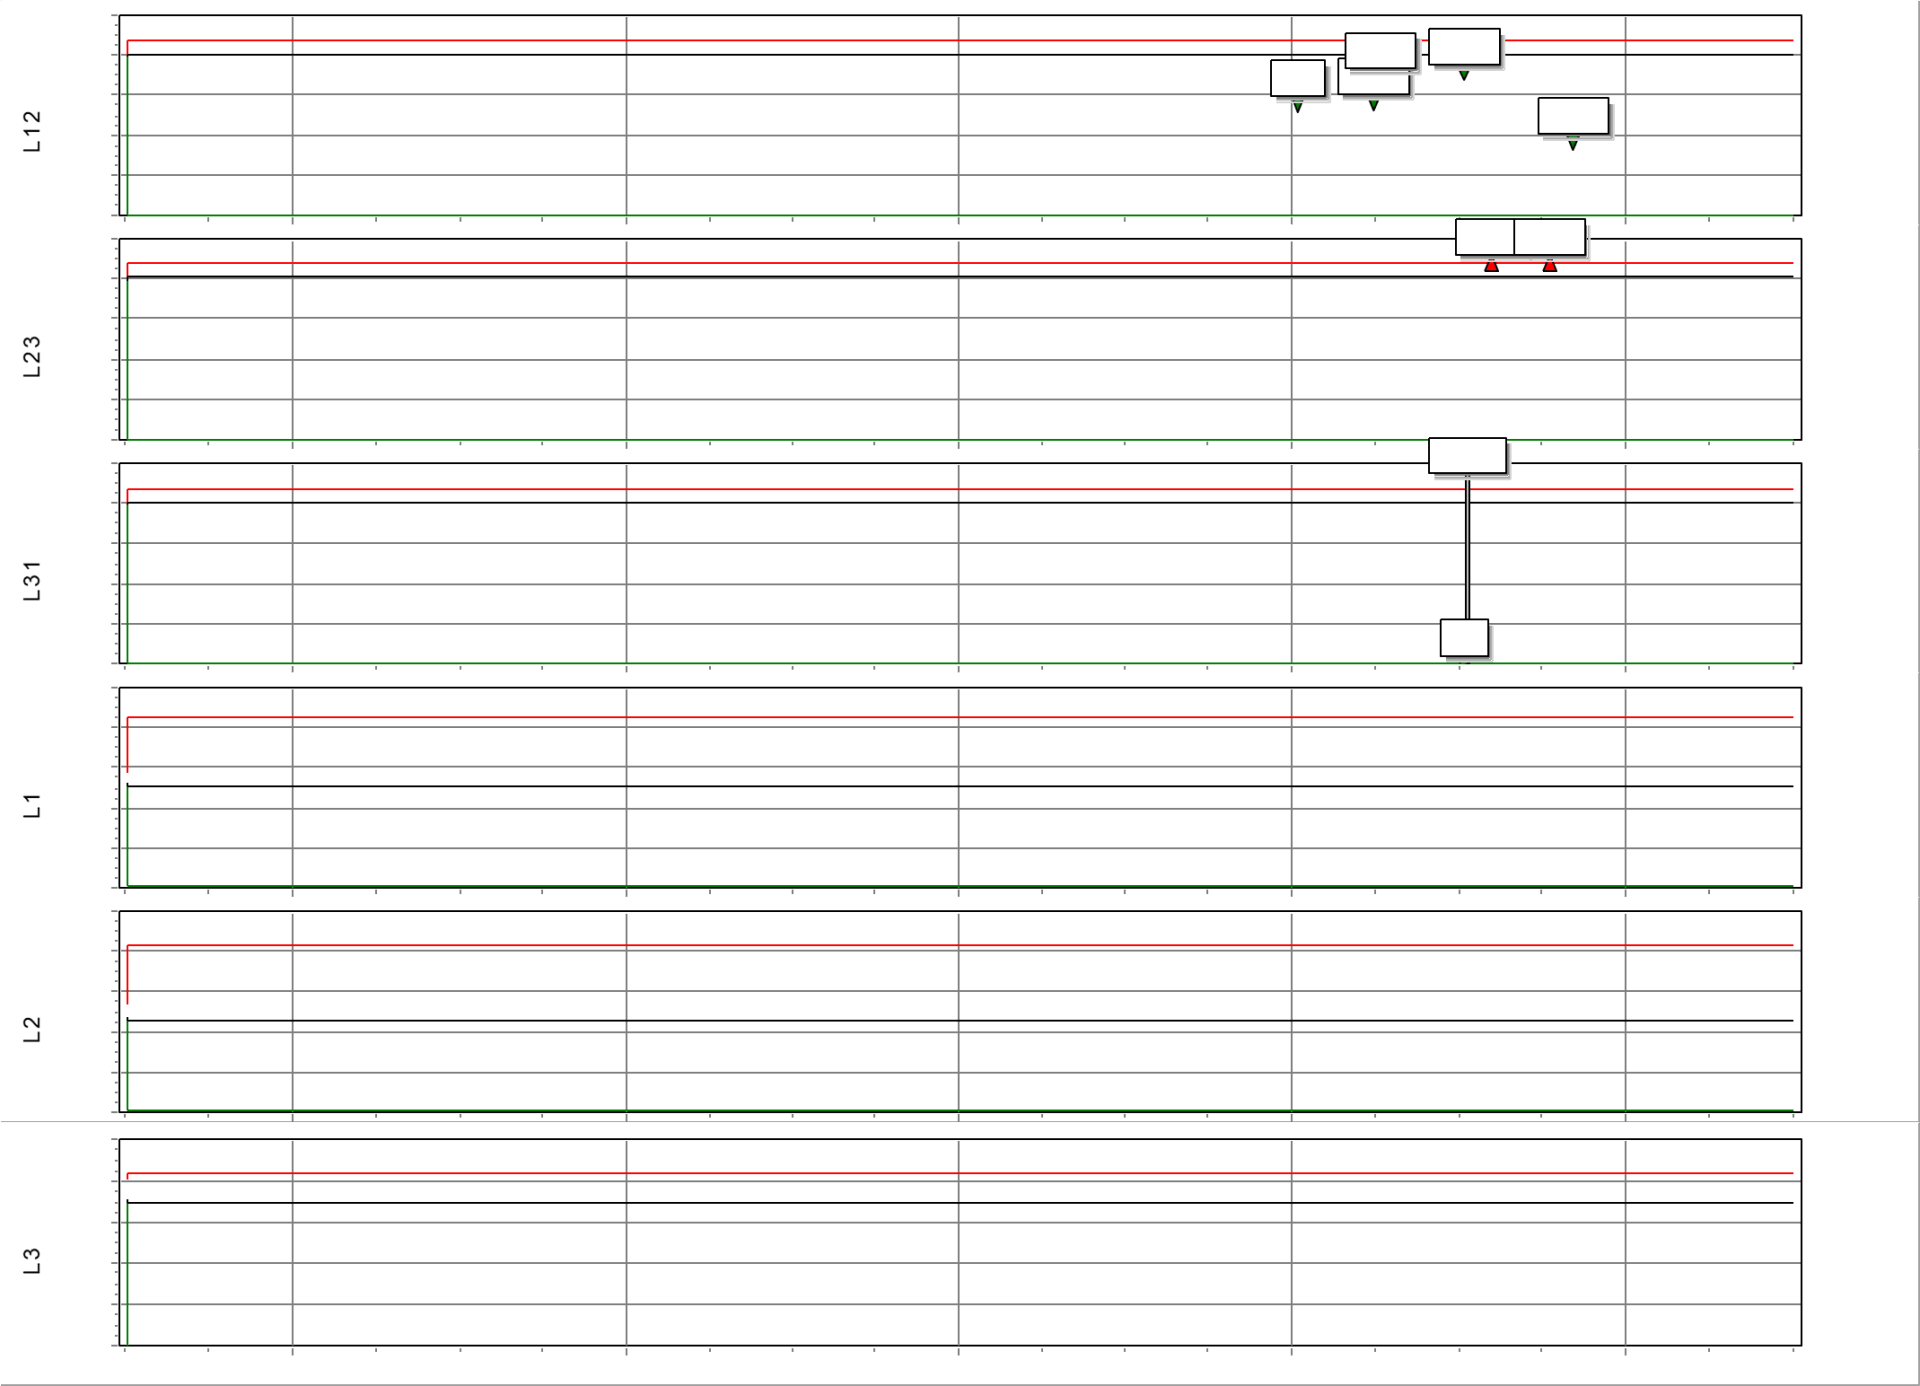
The first 4 “A” phase dips were short duration with the longest lasting 0.13 seconds and the shortest 0.034 seconds.
These dips vary between 30% and 15% below nominal voltage with the first being the lowest and each one rising from there
.
They were followed by the “C” phase dip lasting 1.2 seconds with a voltage reading of 0.1 amps then a complete loss for 0.56 seconds. This dip was 99% below nominal voltage .
The next 2 events are swells on “B” phase with the first lasting 7.8 seconds and the second 2.9 seconds. The swells are both less than 12% above nominal voltage .
The next event is an “A” phase dip lasting 0.7 seconds. The dip was 55% below nominal voltage .
The next event occurred 1 hour 17 minutes later and was again on “A” phase. This dip lasted 0.5 seconds. The dip was 15% below nominal voltage below is a graph that shows this event.
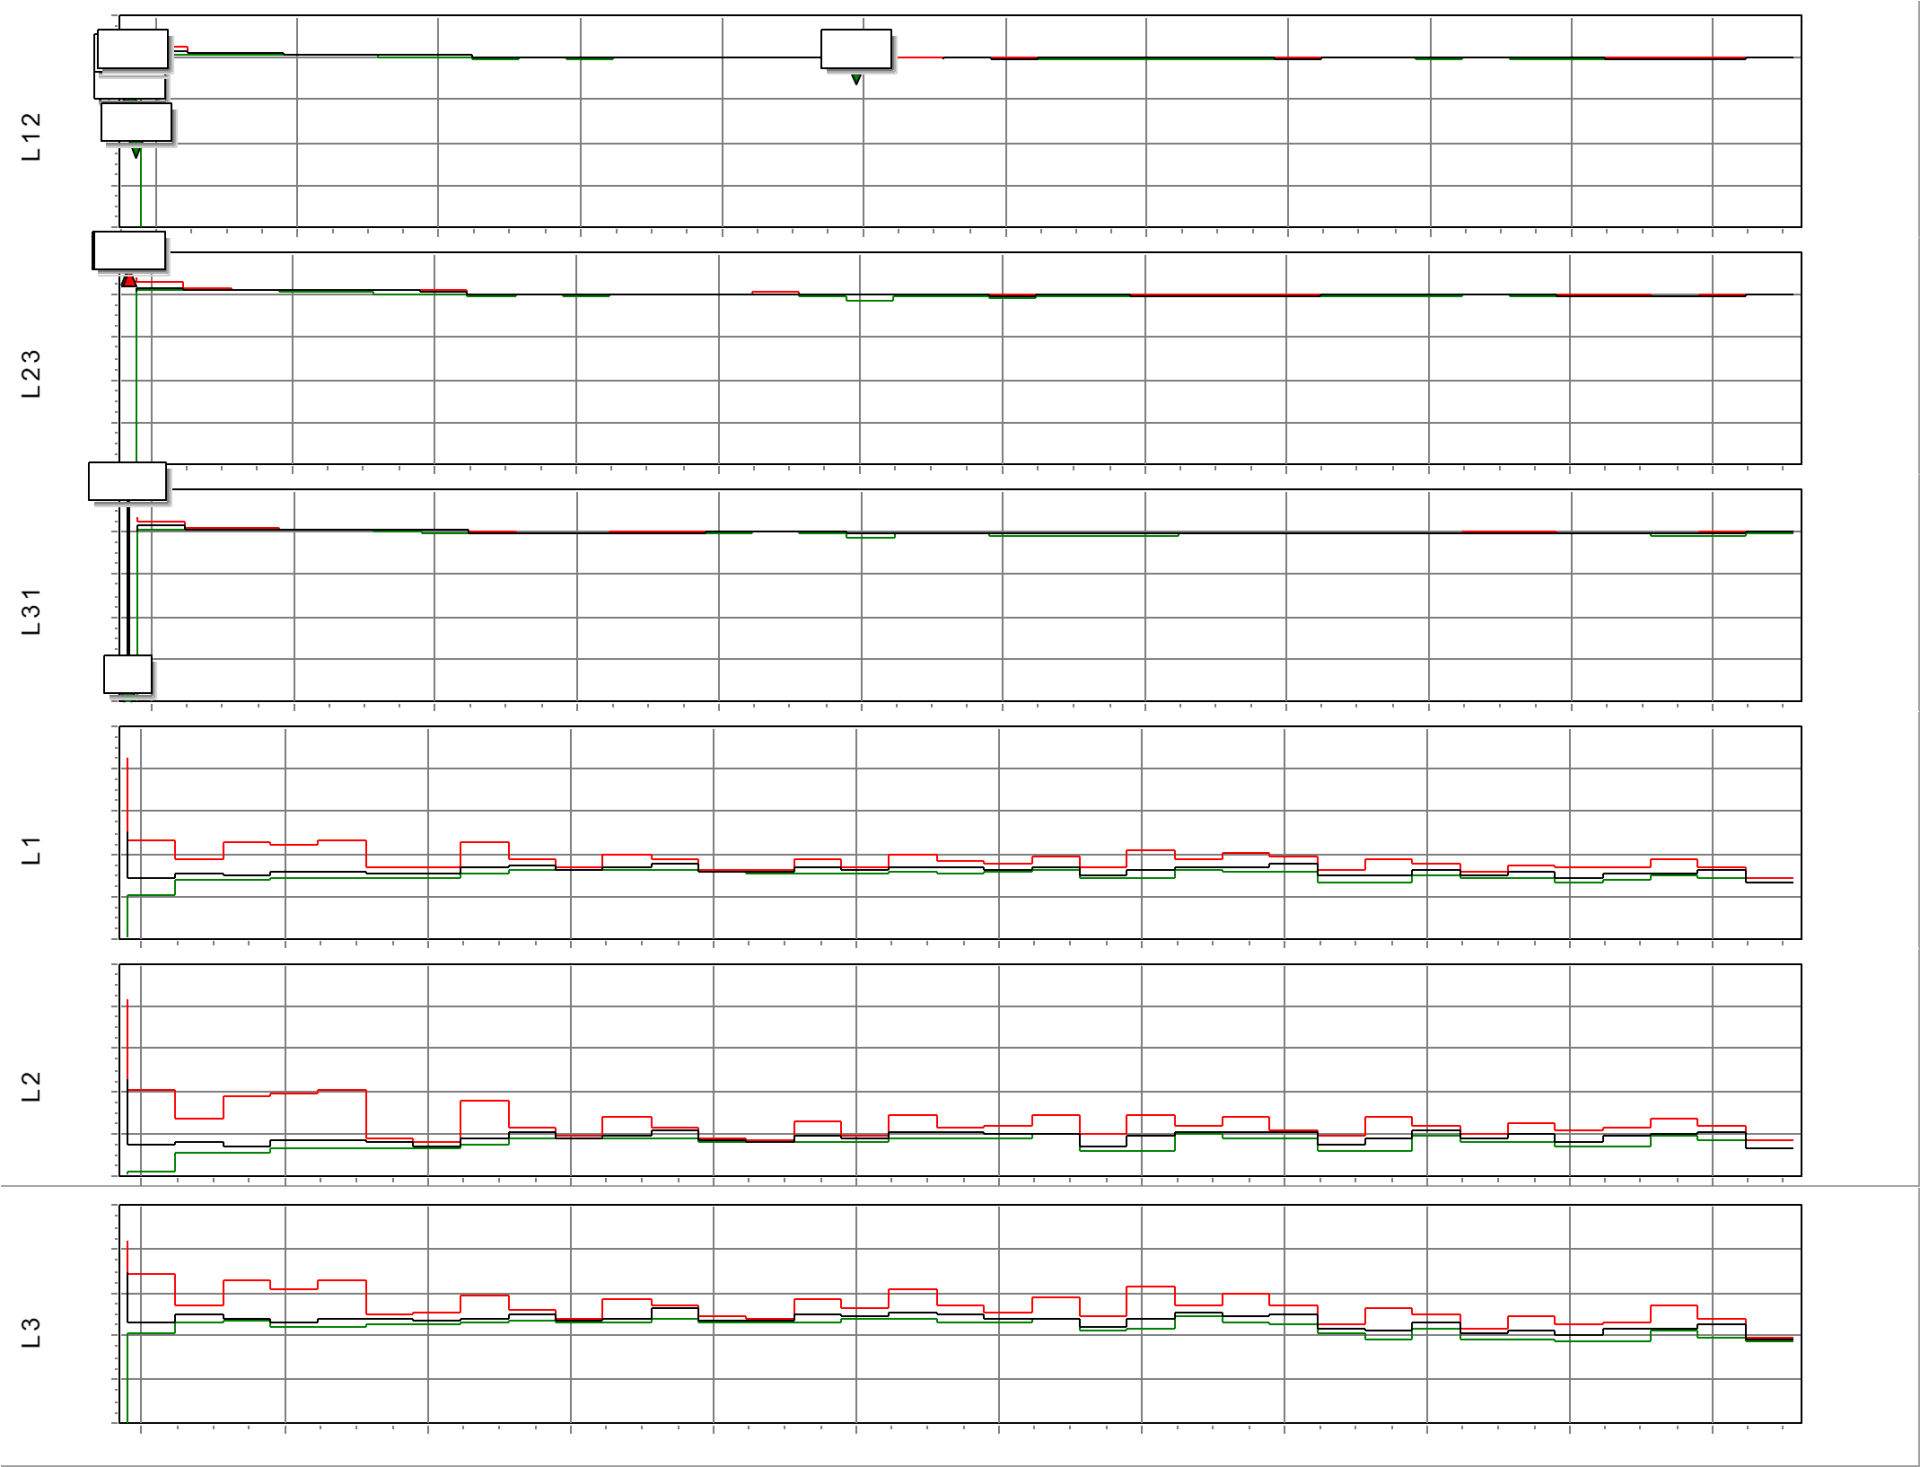
The information we have collected does not give irrefutable evidence of ongoing power quality issues from the power transmission company. We can see that phase “A” had several dips that could affect equipment operation. To get irrefutable evidence would require the more standard 30 day study.
Harmonic distortion:
Harmonic distortion is very low throughout the study, with the first harmonic distorting up to 100% and no other distorting more than 2% on voltage and 16% on the amperage. In the graphs below the first harmonic is yellow, the third is blue, the fifth is red and the THD is black.
Harmonic distortion is very low throughout the study, with the first harmonic distorting up to 100% and no other distorting more than 2% on voltage and 16% on the amperage. In the graphs below the first harmonic is yellow, the third is blue, the fifth is red and the THD is black.
THD without 1st Harmonic
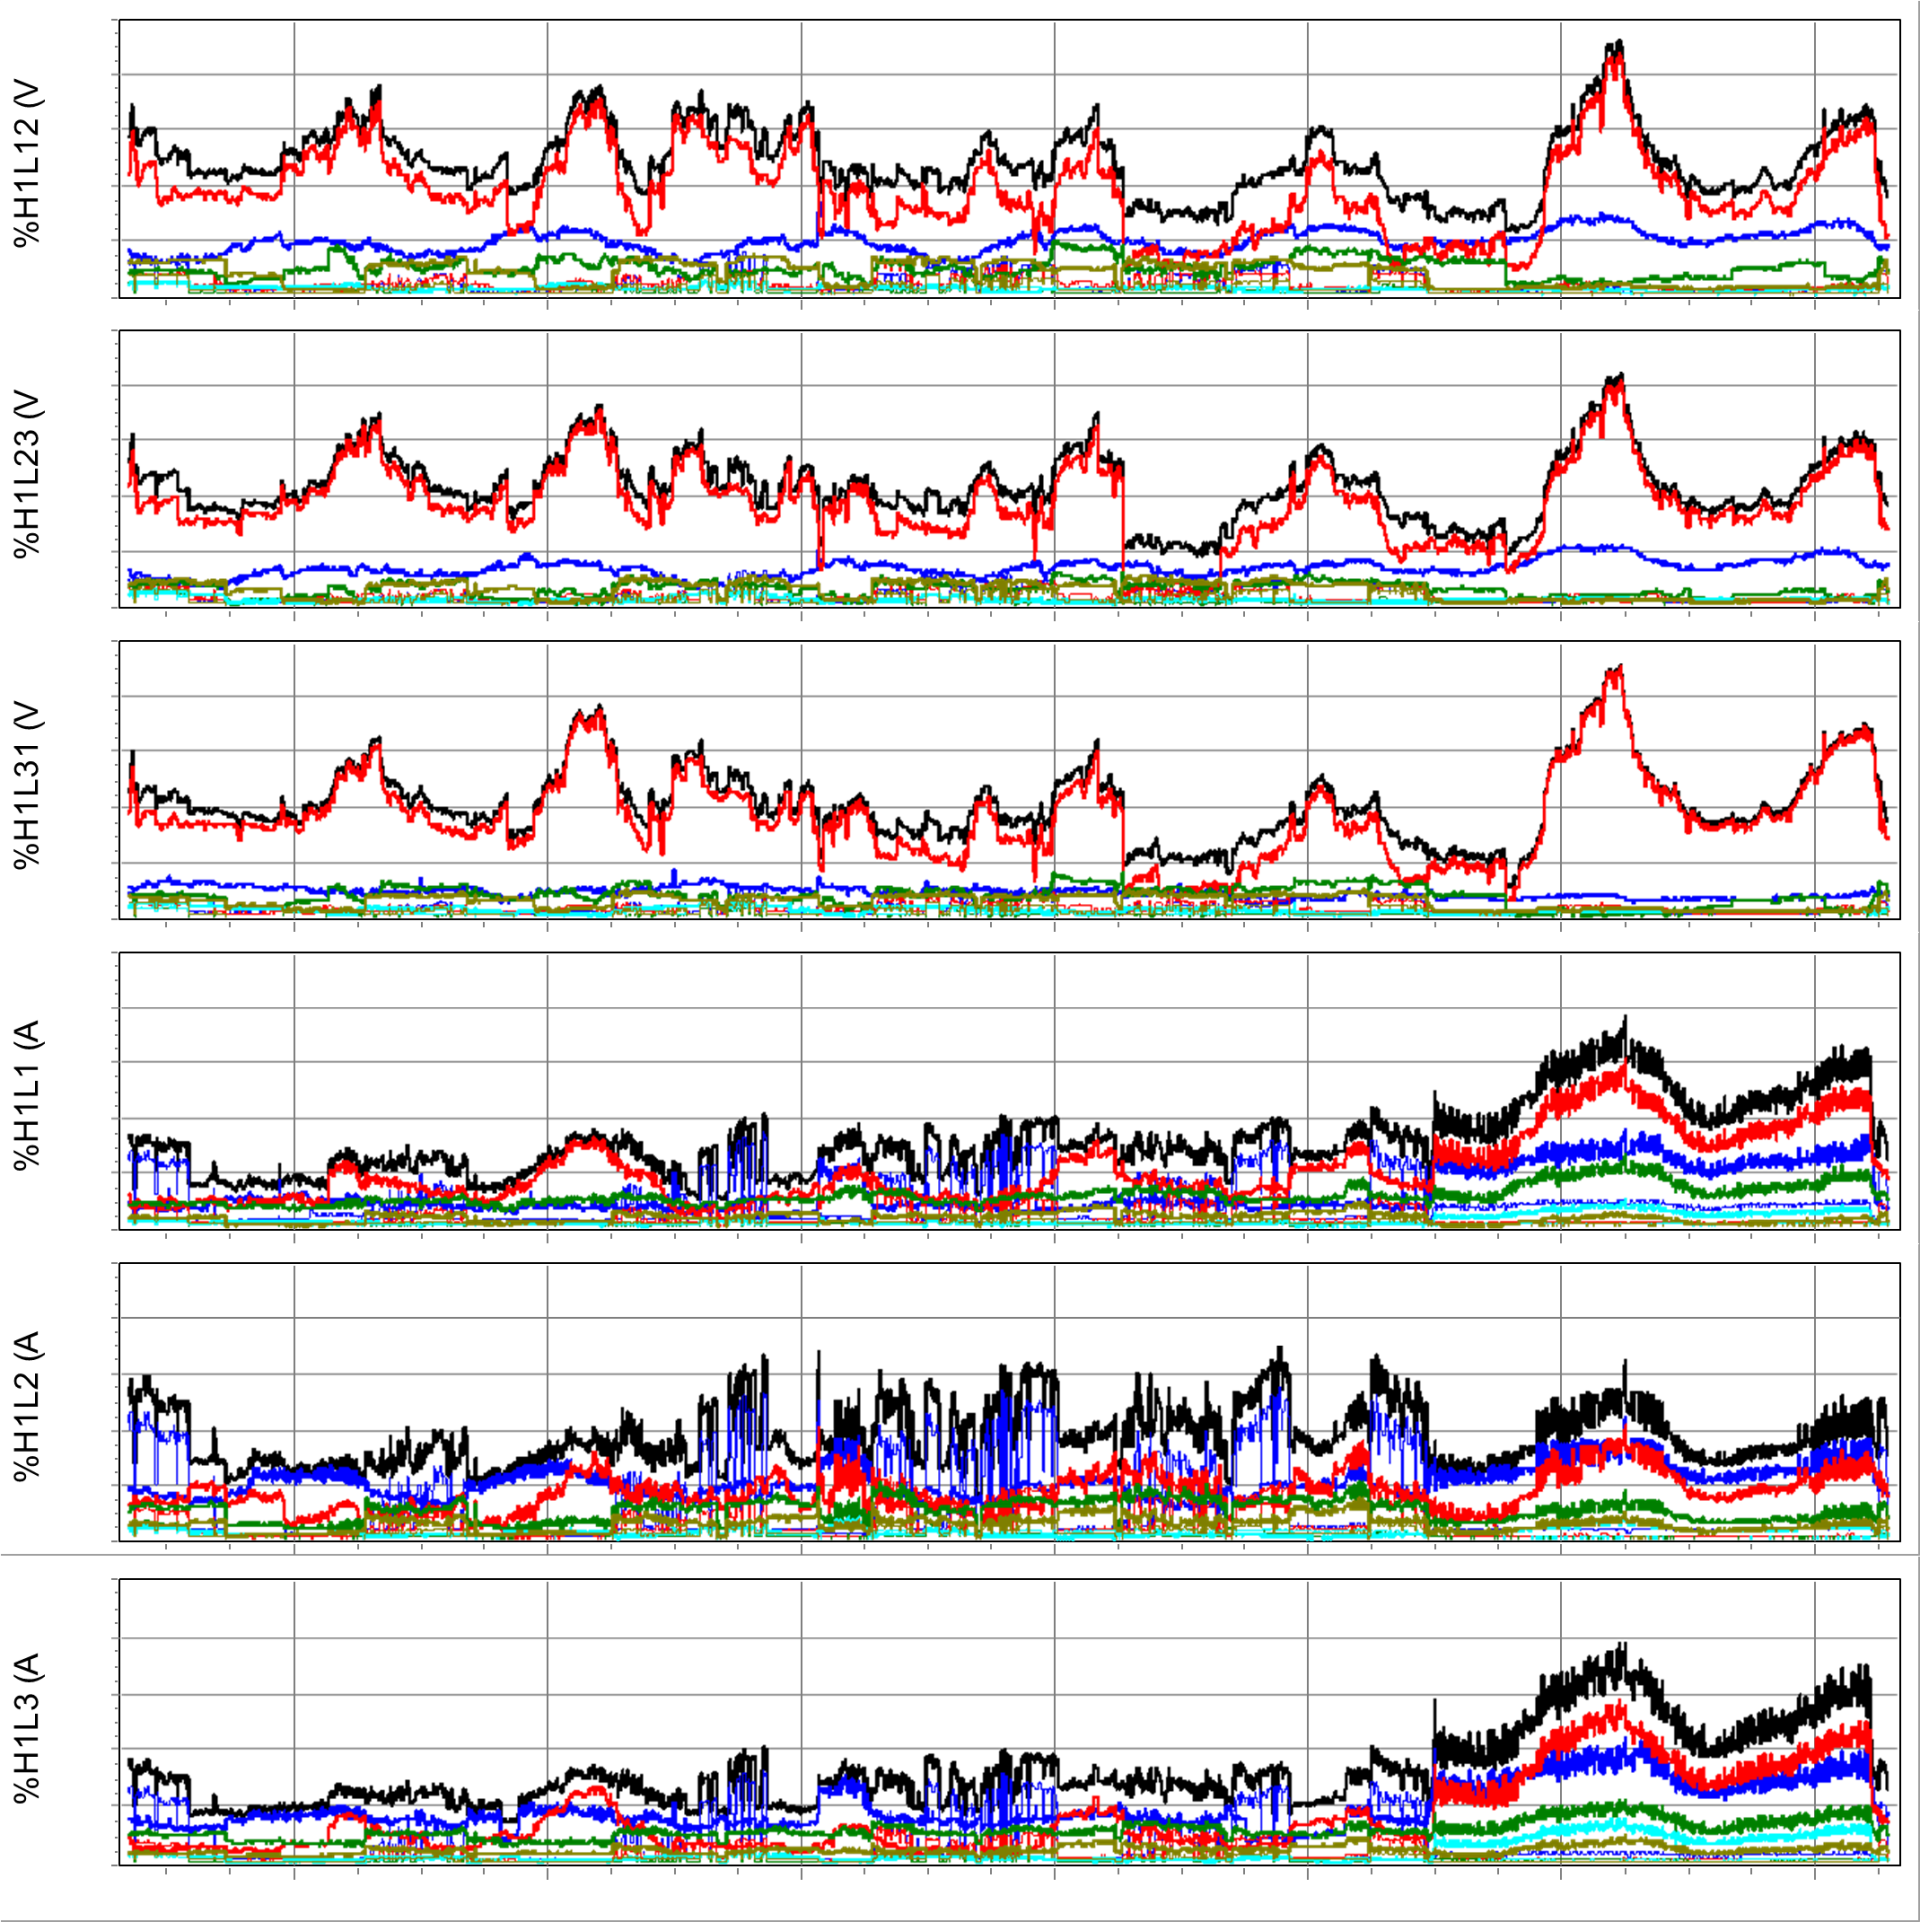
THD with 1st Harmonic
Frequency:
Frequency was very stable varying only .5 hertz plus or minus from the nominal 60 hertz except during the power failure. Below is the week long graph.
Frequency was very stable varying only .5 hertz plus or minus from the nominal 60 hertz except during the power failure. Below is the week long graph.
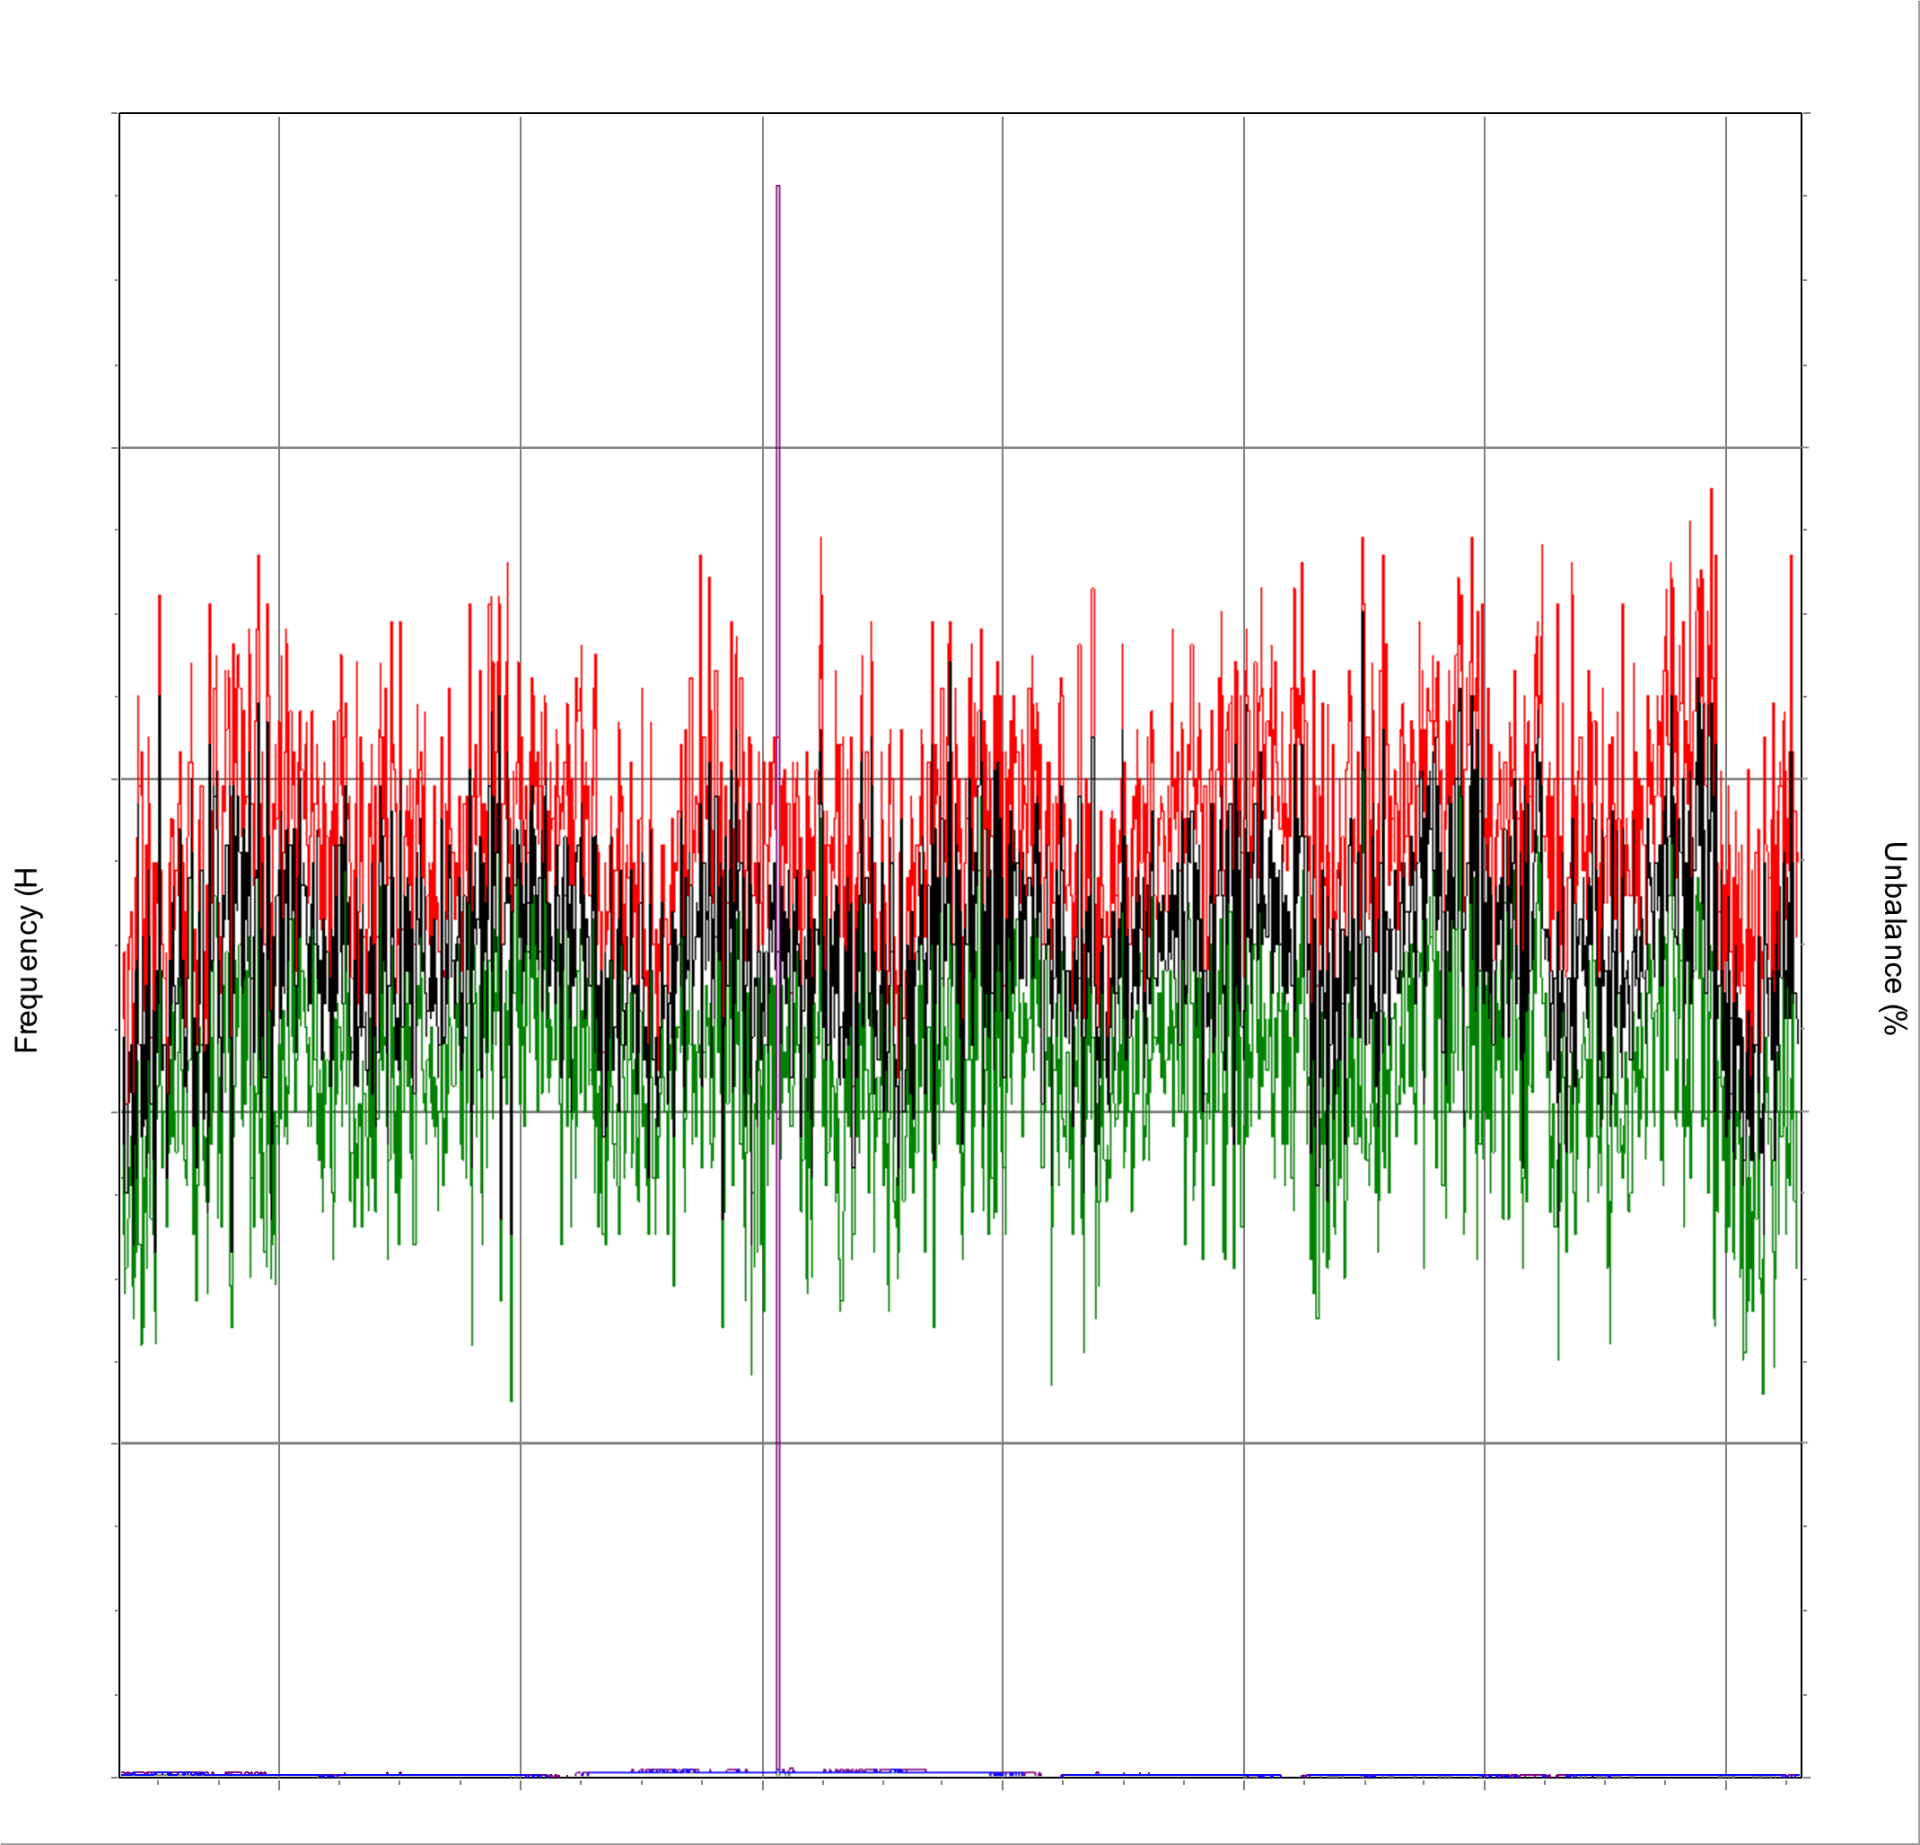
The blue line at the bottom is the voltage unbalance negative percent. It is steady at 0%.
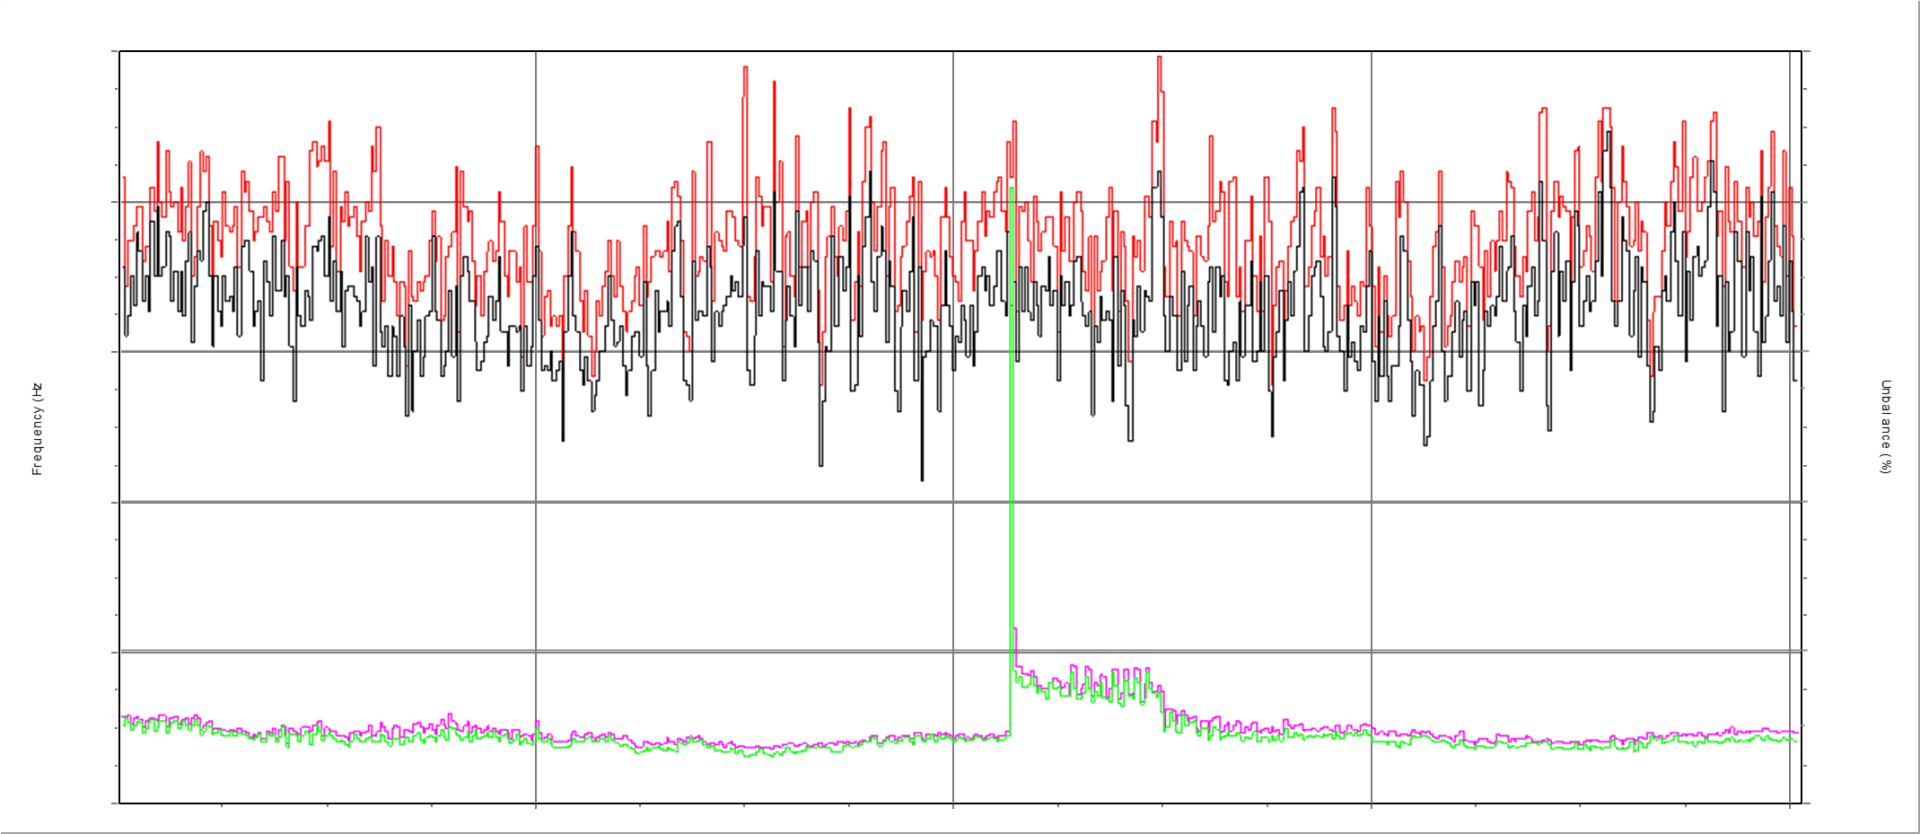
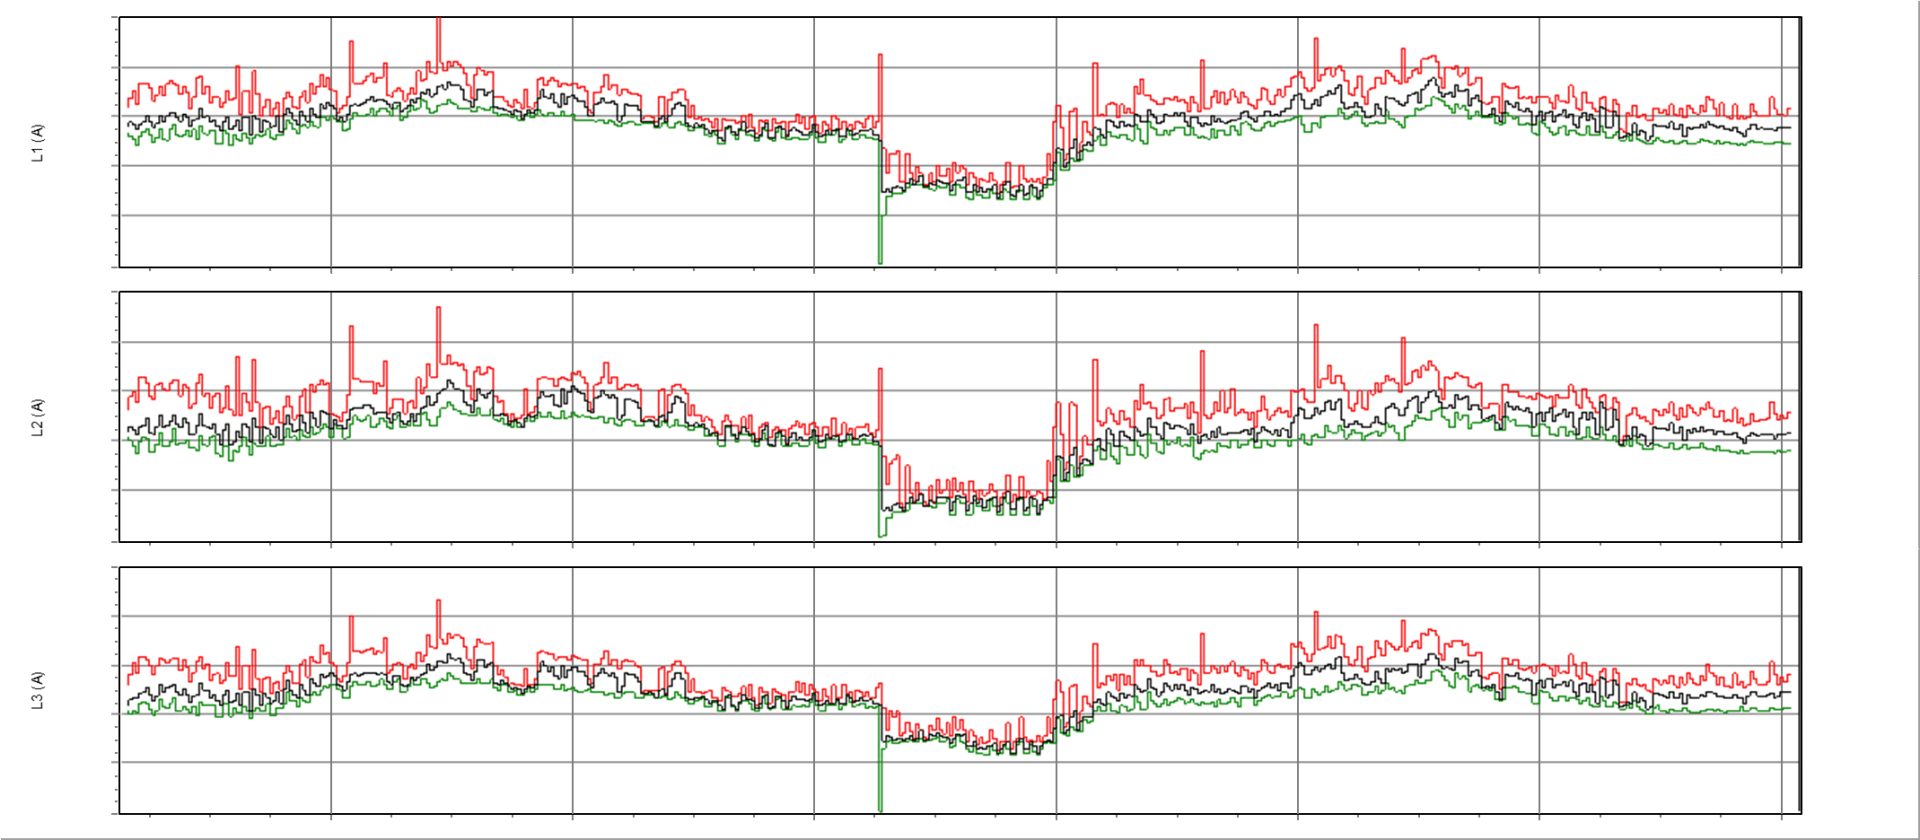
I have added this page because the amperage frequency unbalance changes after the power outage. If we compare the amperage usage and the unbalance seen below we see a 4 hour and 20 minute period when amperage was down and frequency unbalance was up. This could be caused by equipment that was running at the time of the power interruption not being started again until the day shift started at around 6:00 am. I do see more unbalance on the weekend when production is closed. I just think it should be noted and investigated to verify this is not a problem.
Frequency with Amperage unbalance
Amperage for Comparison
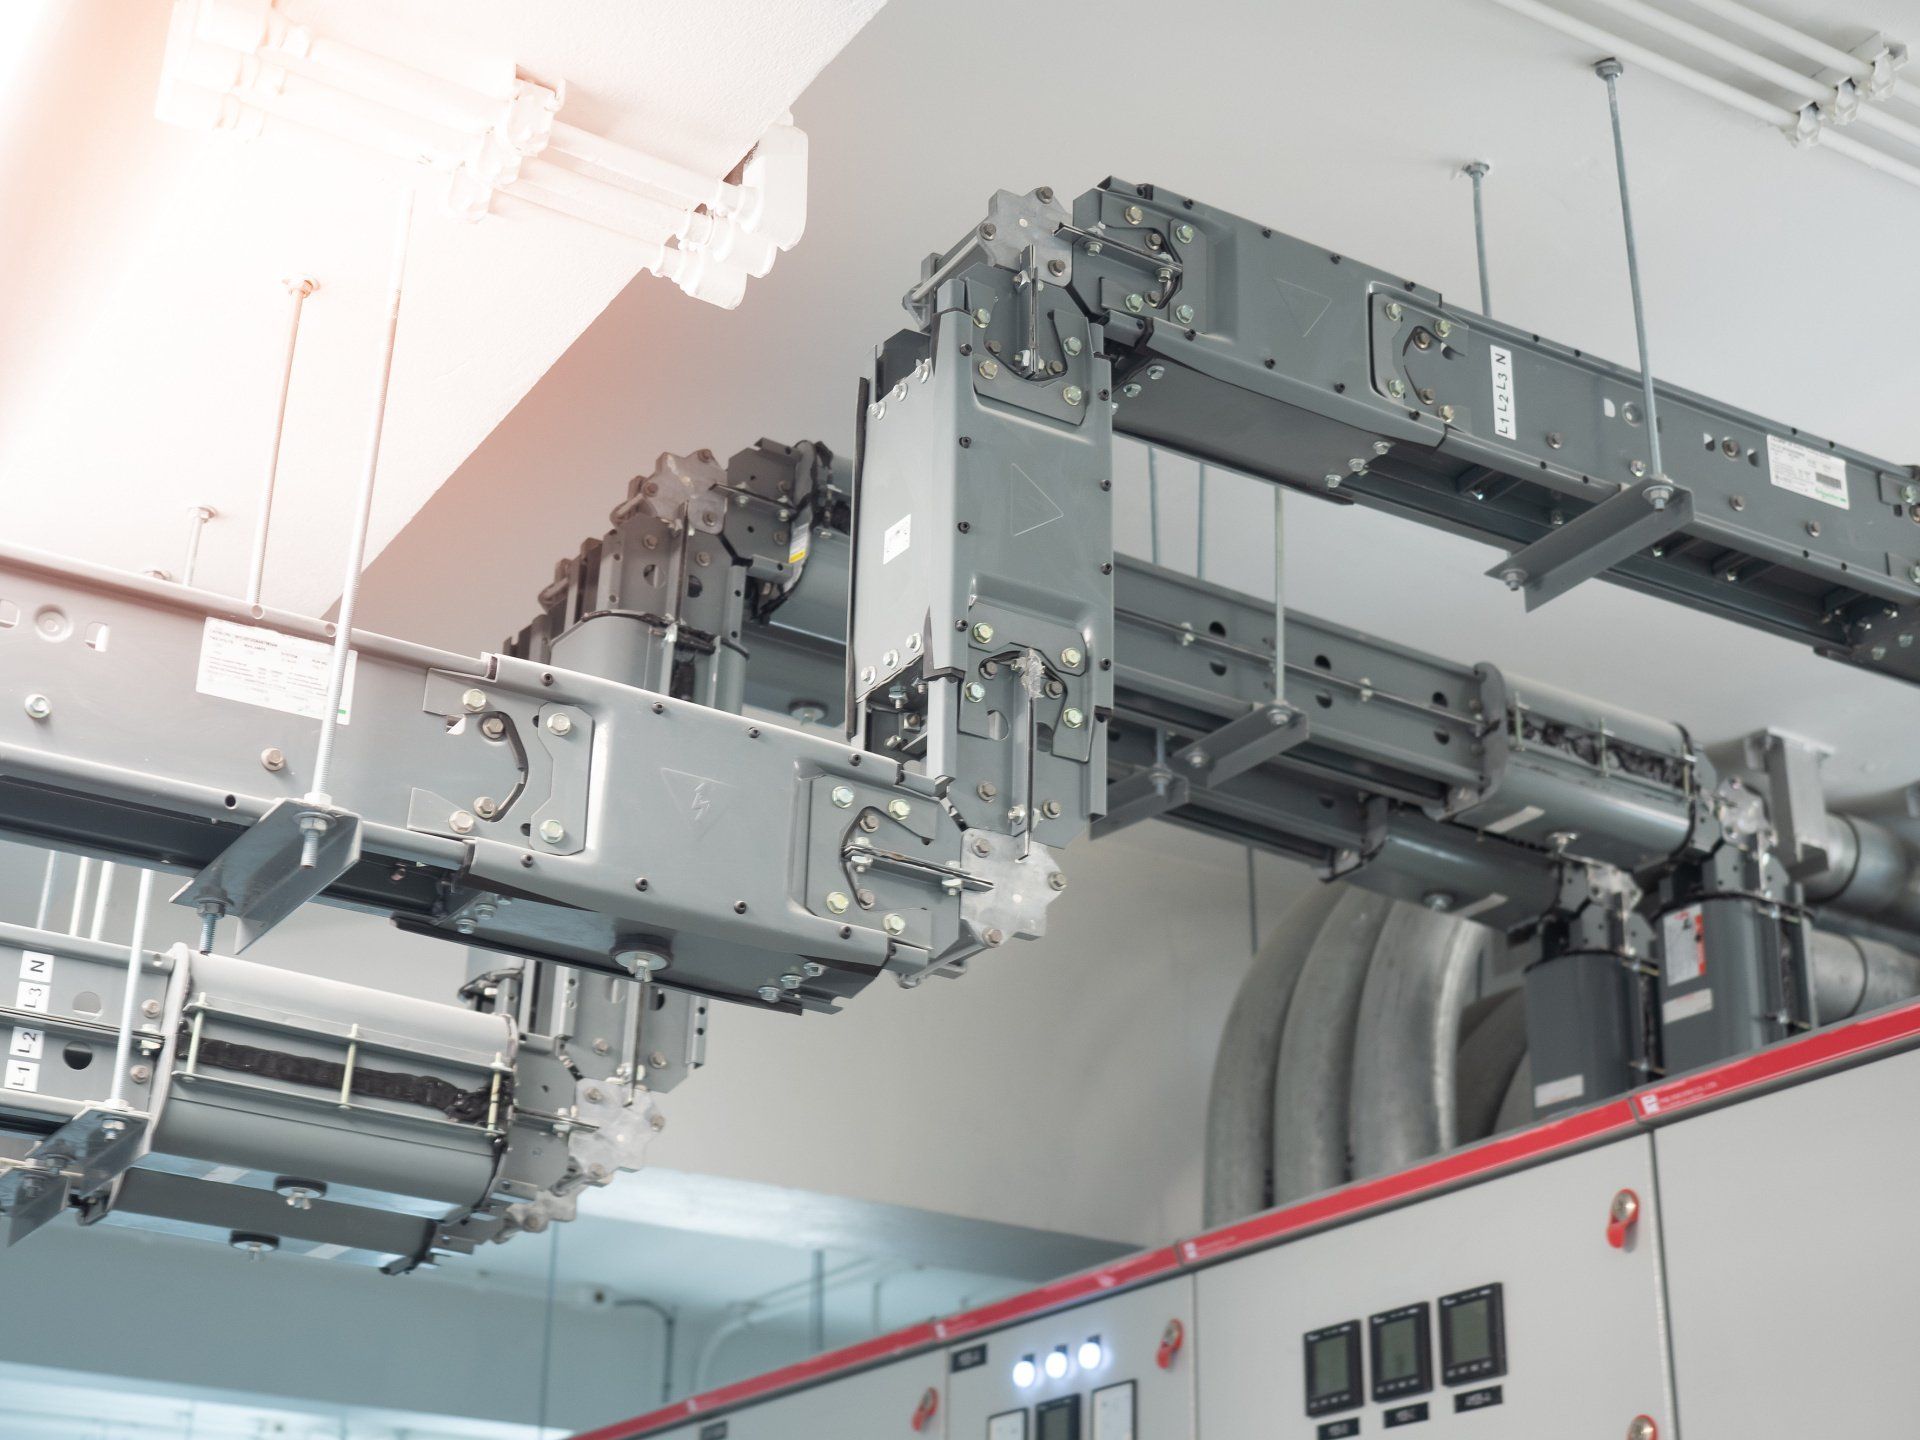
Busrail System Issues Report
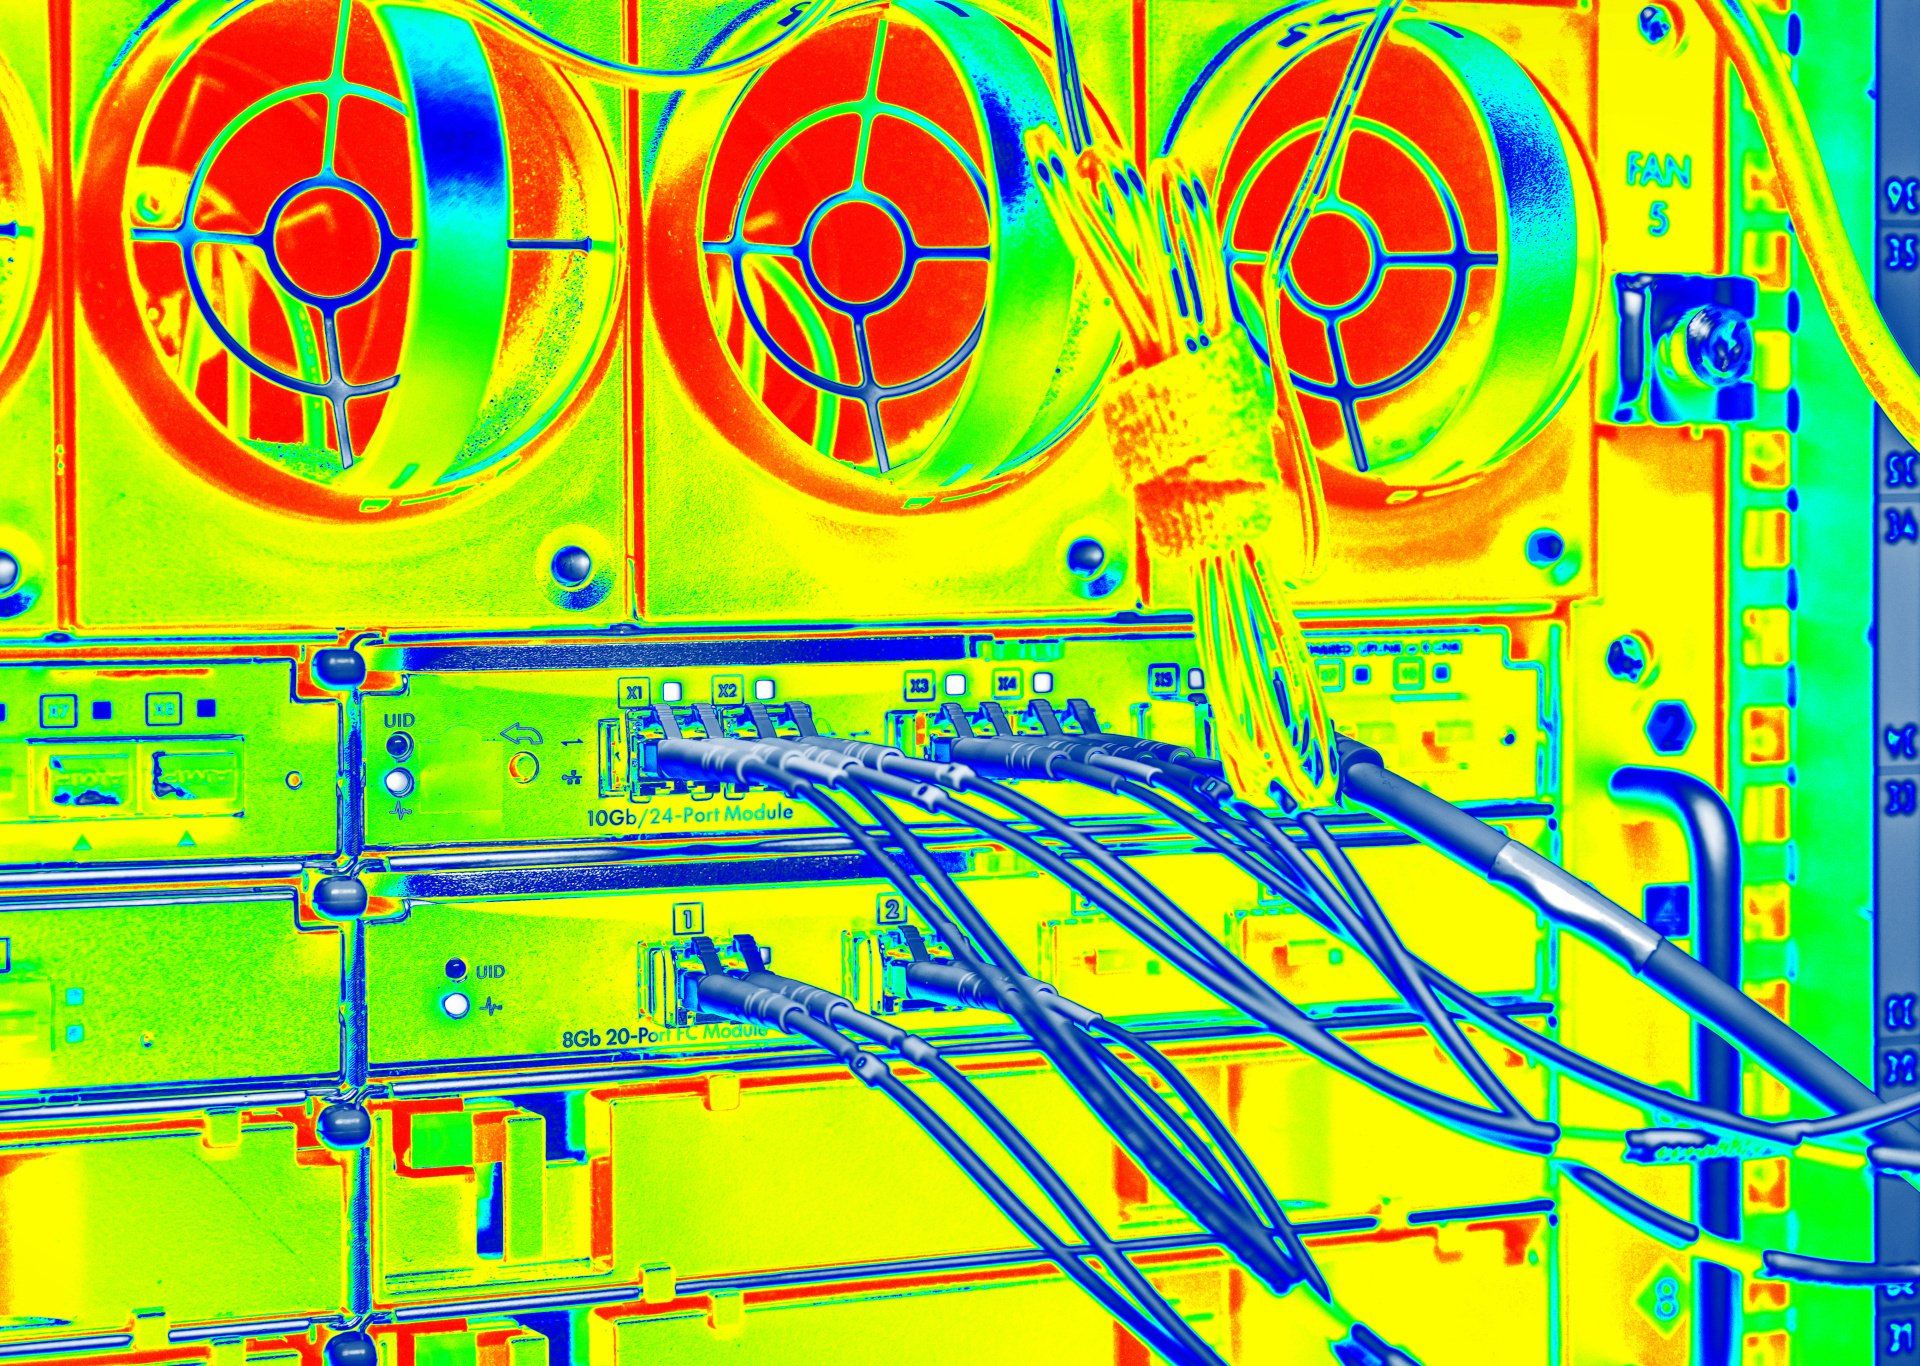
Non-Invasive Thermal Imaging Through Protective Grates

Panoptic Solutions LLC

Panoptic Solutions LLC

Panoptic Solutions LLC

Watch List Exception Report
Panoptic Solutions LLC

Panoptic Solutions LLC
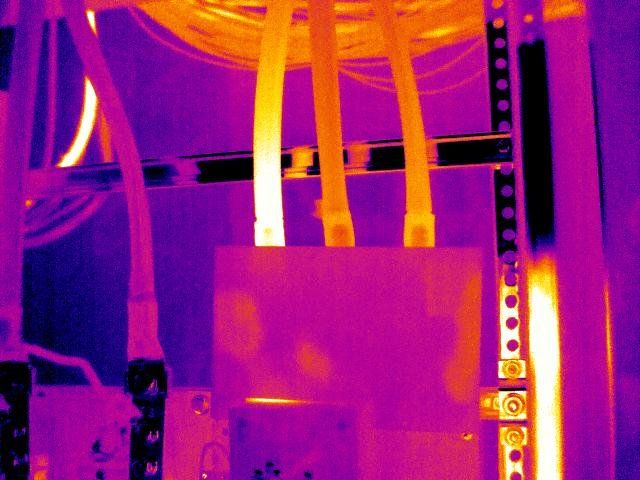
Non-Invasive Thermal Imaging Through Protective Grates

PANOPTIC SOLUTIONS LLC
Optimize your maintenance cycles
Save Money - Avoid Downtime